Hi, I invite you to explore my work. I showcase a range of data-driven projects created using Excel, Python, and Power BI. Each project highlights my analytical skills and my ability to transform raw data into valuable insights. The projects range from complex data visualizations in Power BI to automation and statistical analyses in Python and comprehensive dashboards in Excel, and they reflect my dedication to using data to deliver clear and impactful solutions.
This project is part of my Udacity Nanodegree program, which analyzes the PISA2012 dataset to explore factors influencing the academic performance of 15-year-old students. It investigates the impact of school choice, gender, location, student attitudes, and teacher practices on student scores. I examine key factors such as socio-economic status, teacher-student relations, and computer access, revealing insights into how these variables affect student performance across OECD and non-OECD countries.
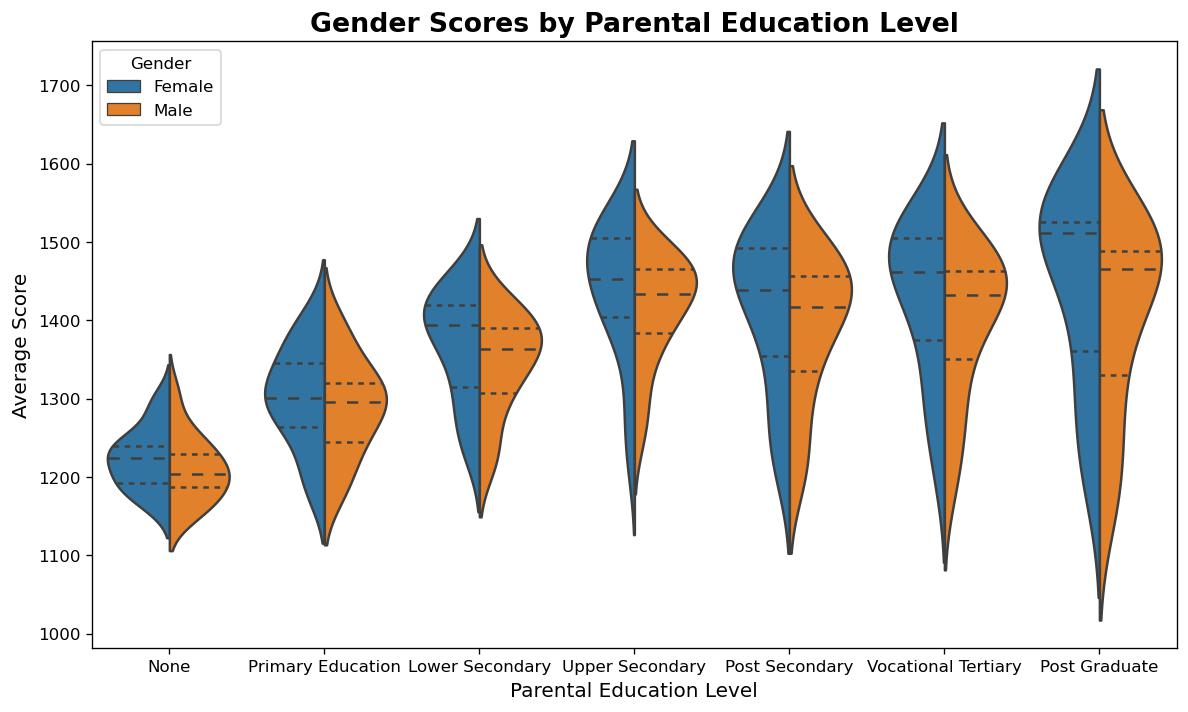
These insights examine how parental education level, gender, access to technology, teacher-student relations, and other factors influence student performance in mathematics, science, and literacy.
The International Student Assessment (PISA) was initiated by OECD member states to evaluate the reading, mathematics, science, and financial literacy skills of 15-year-old students. Conducted every three years, it focuses on applying school knowledge to real-life challenges. The PISA2012 dataset includes 510,000 students, 485,490 observations, and 636 features.
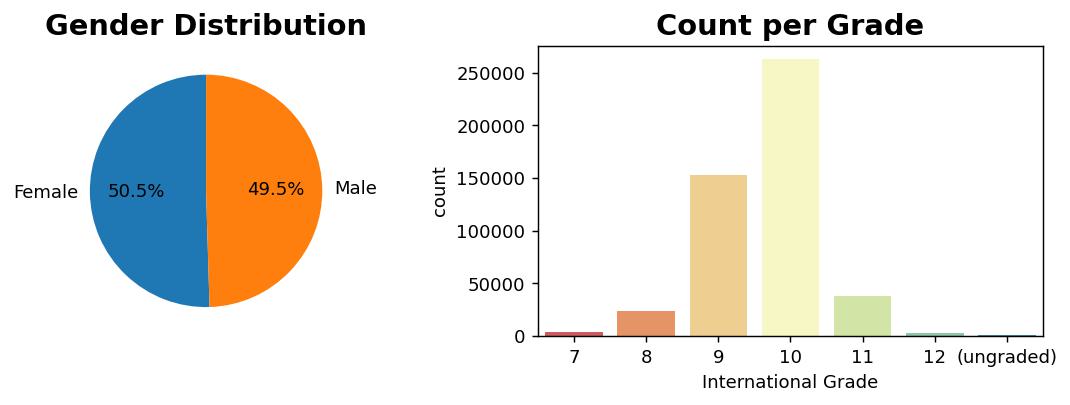
KPI: Proportion of male vs. female students participating in the PISA assessment.
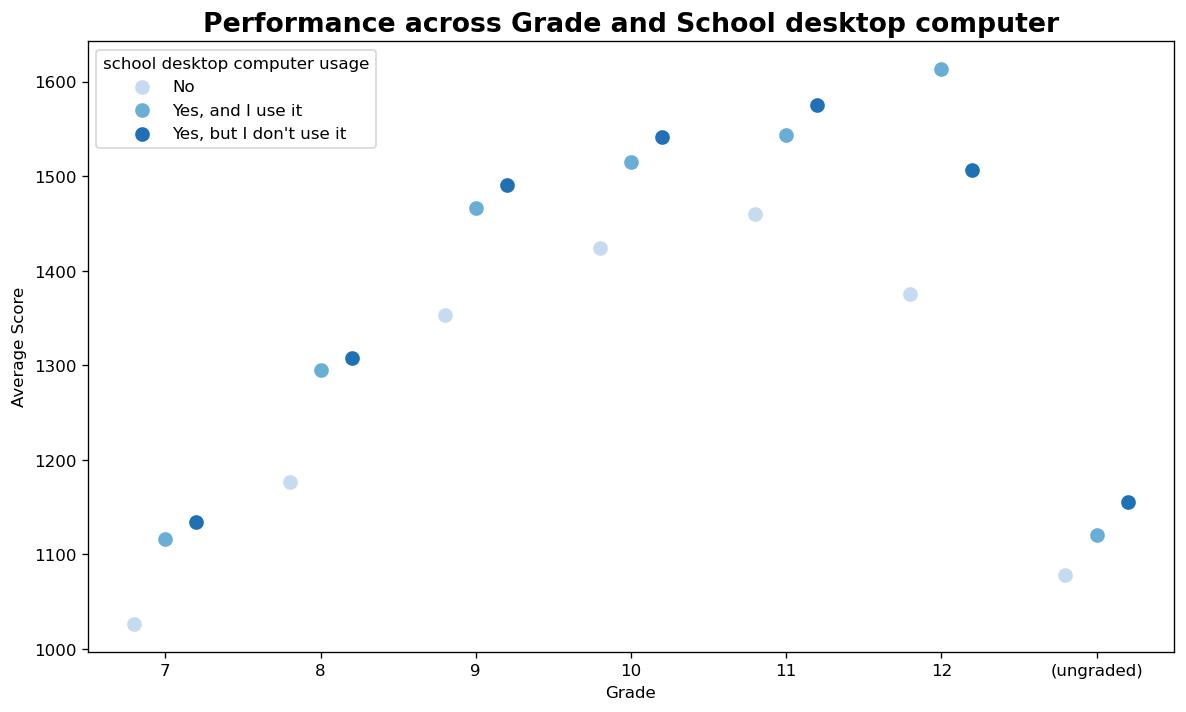
Insight: In the PISA interview, 50.5% of participants were female, while 49.5% were male. This indicates a slight overrepresentation of female students. Additionally, most students were from grades 10 (58%) and 9 (34%).
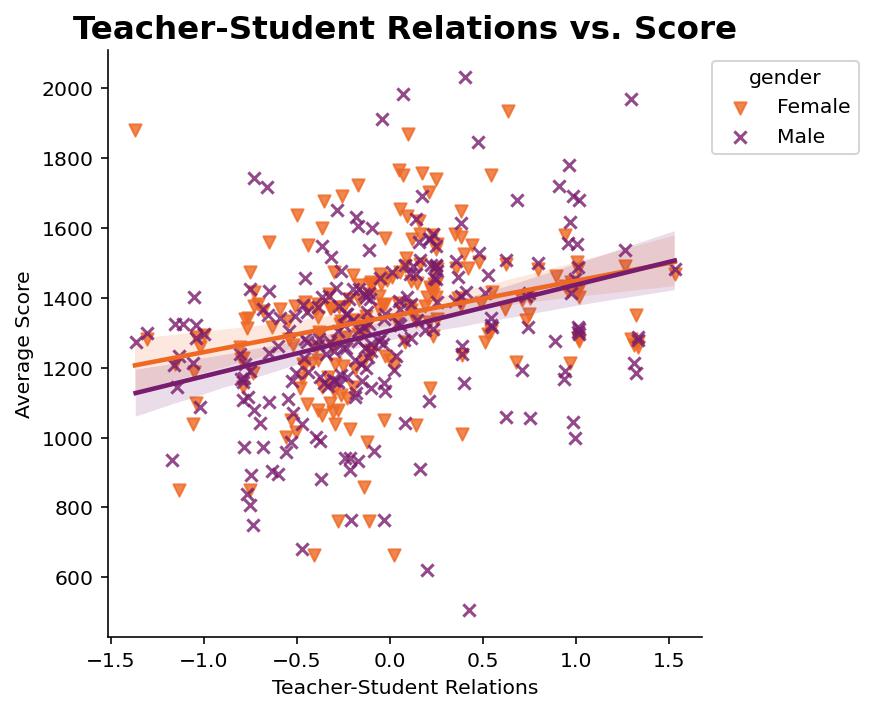
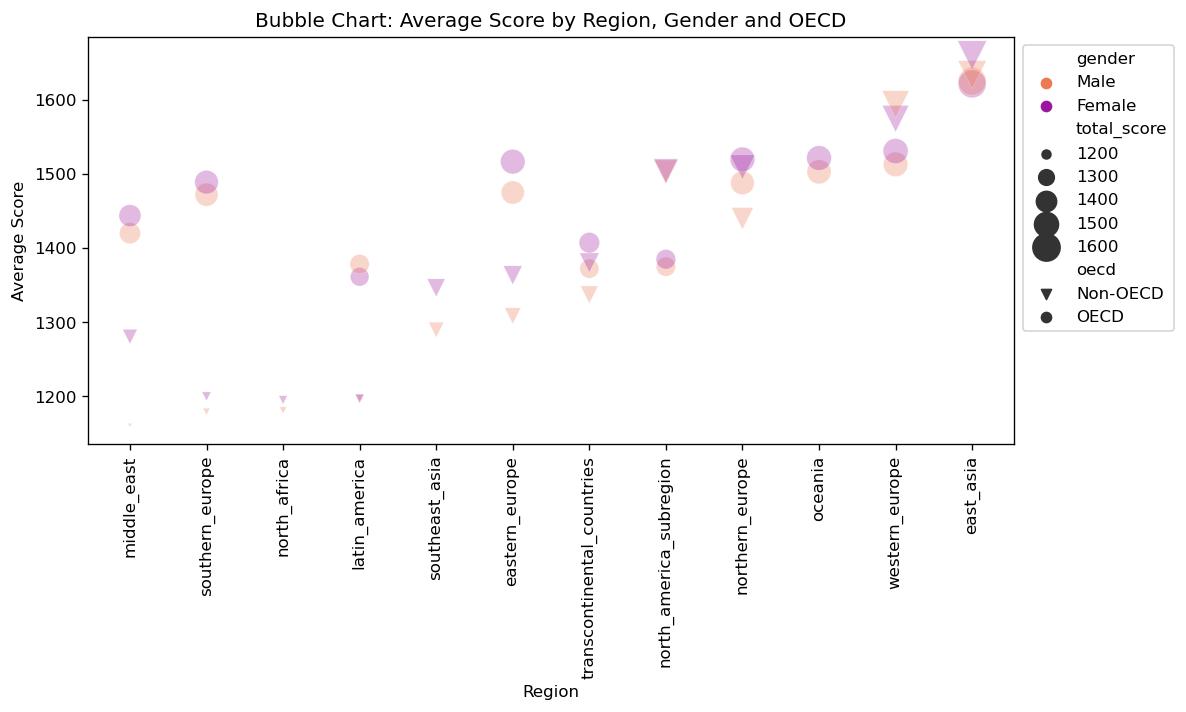
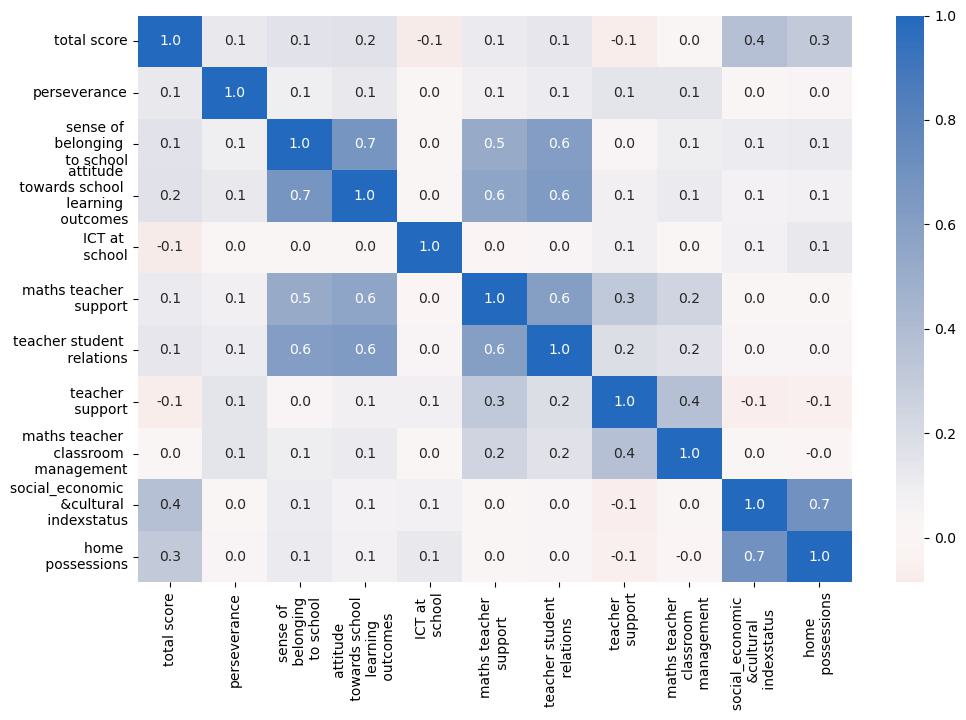
KPI: Impact of teacher-student relations on gender-based performance.
Insight: Teacher-student relations significantly influence the performance of both male and female students. However, female students appear to benefit more positively from strong teacher-student relationships compared to their male counterparts. This suggests that fostering strong teacher-student connections may be particularly beneficial for enhancing the academic outcomes of female students.
The project was initiated by the sub-county director of education. The task is to analyze the KCSE 2023 results for 19 schools, encompassing around 2,400 students. The analysis compares the 2023 results with those from 2022 and 2021, focusing on grade distribution, gender performance, school rankings, and subject improvement. The findings will guide future strategies and enhance student performance.
These findings offer valuable insights into the academic performance landscape within the sub-county and set a clear foundation for planning, policy formation, and targeted educational interventions to address existing gaps.
The data was sourced from 19 schools in the sub-county, encompassing performance records for about 2400 students in the KCSE 2023 exams, and incorporated 2022 and 2021 historical data for year-on-year comparison. The data covers individual and aggregate performance across gender, subjects, and school rankings.

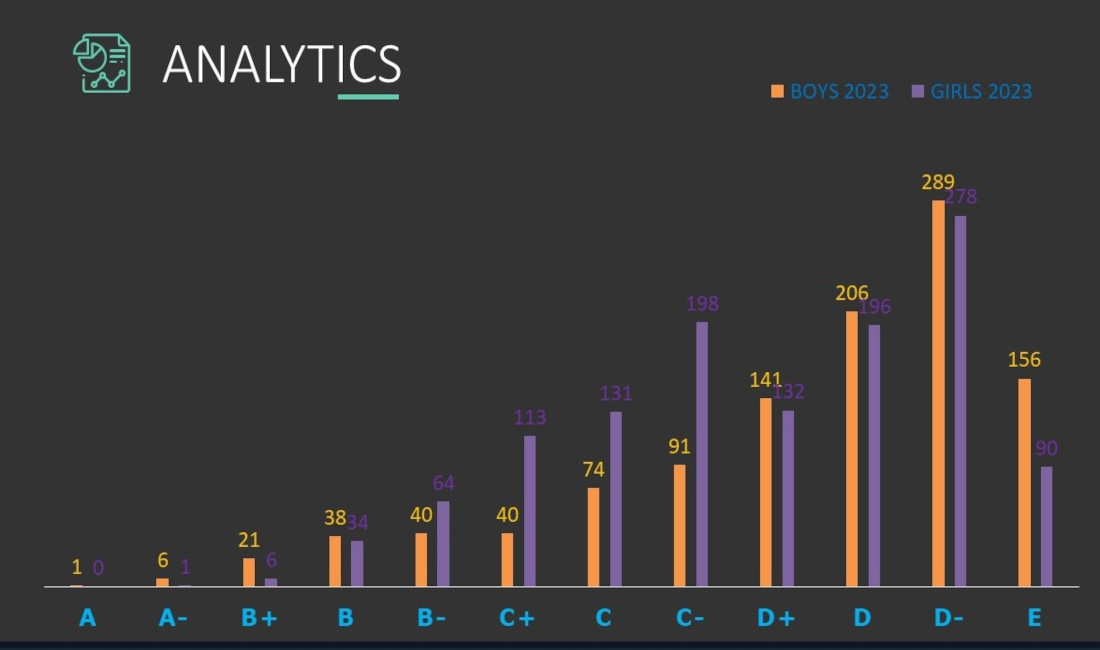
KPI: Proportion of male vs. female students obtaining C+ or higher.
Insight: In 2023, only 15% of students scored C+ or higher, with 17% being girls and 13% boys. This shows a slightly higher academic performance among female students, underscoring the possibility that girls may benefit more from existing supportive learning environments or are better equipped with study strategies. Targeted support to address gender-specific needs.
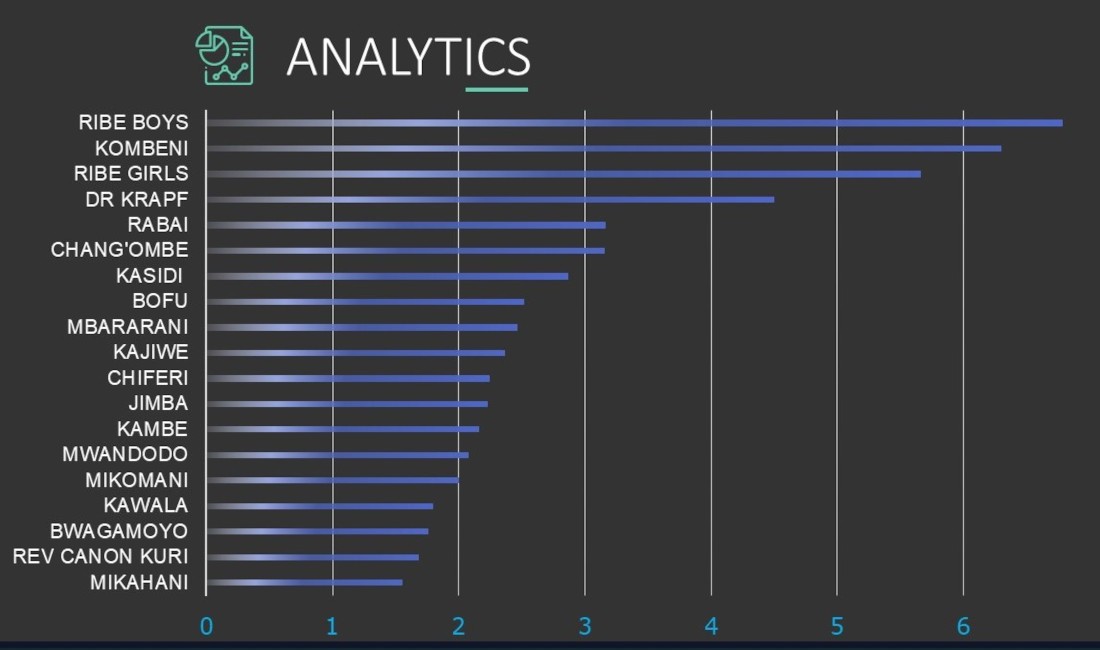
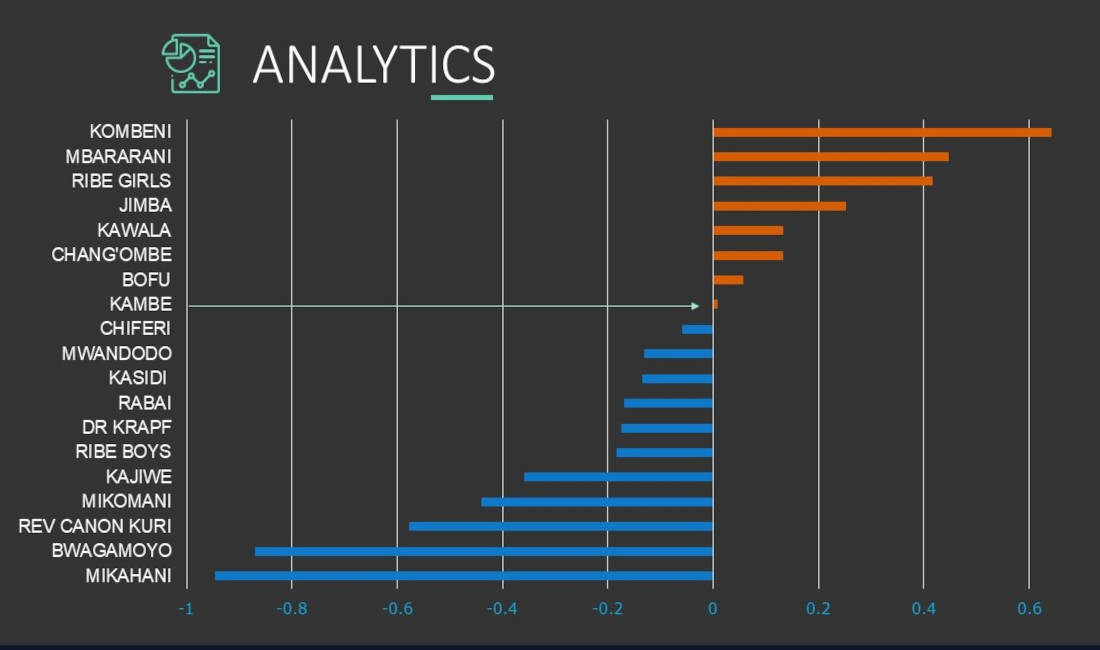
KPI: Ranking of schools based on overall performance.
Insight: Ribe Boys, Kombeni Girls, and Ribe Girls topped the rankings, while Bwagamoyo, Rev Canon Kuri, and Mikahani were at the bottom. Top schools may have benefited from strong academic programs and experienced staff, whereas lower-performing schools struggle with limited resources and high teacher turnover. Improving these schools could involve better resource allocation, teacher training, and student engagement.
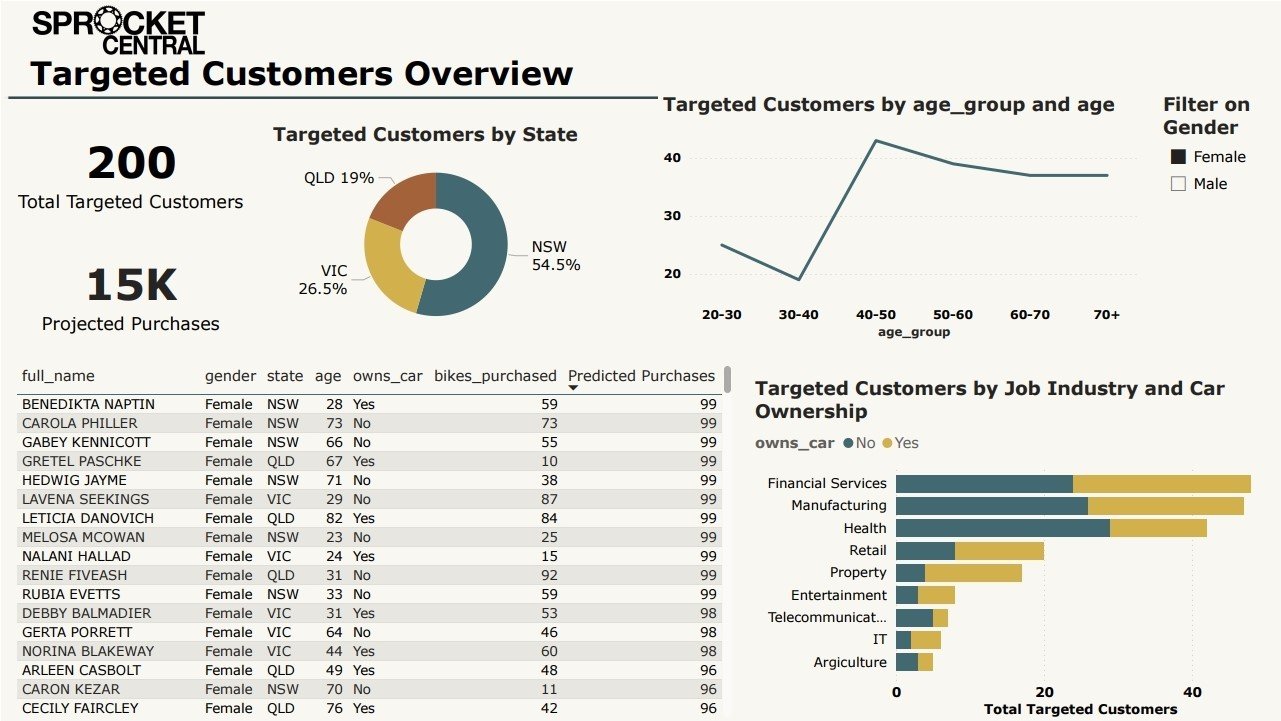
The project involves analyzing Sprocket Central Pty Ltd's datasets, including customer demographics, addresses, and transaction data, to optimize marketing strategies. By assessing data quality and applying analytics, the goal is to identify trends, behaviors, and high-value customers among 1000 new prospects. The strategy spans data exploration, feature engineering, predictive modeling, and results interpretation to enhance targeted marketing, boost customer engagement, and drive business growth.
Insights into customer demographics, purchasing behavior, and market trends provide a strong foundation for data-driven marketing strategies, targeted promotions, and optimized sales approaches. Hence enhancing customer engagement and driving long-term business growth for Sprocket Central Pty Ltd.
The project uses three datasets: customer demographics, customer addresses, and three months of transaction data. We explore the datasets for quality assessment, feature engineering to uncover insights, optimize customer segmentation, and guide targeted marketing strategies for business growth.
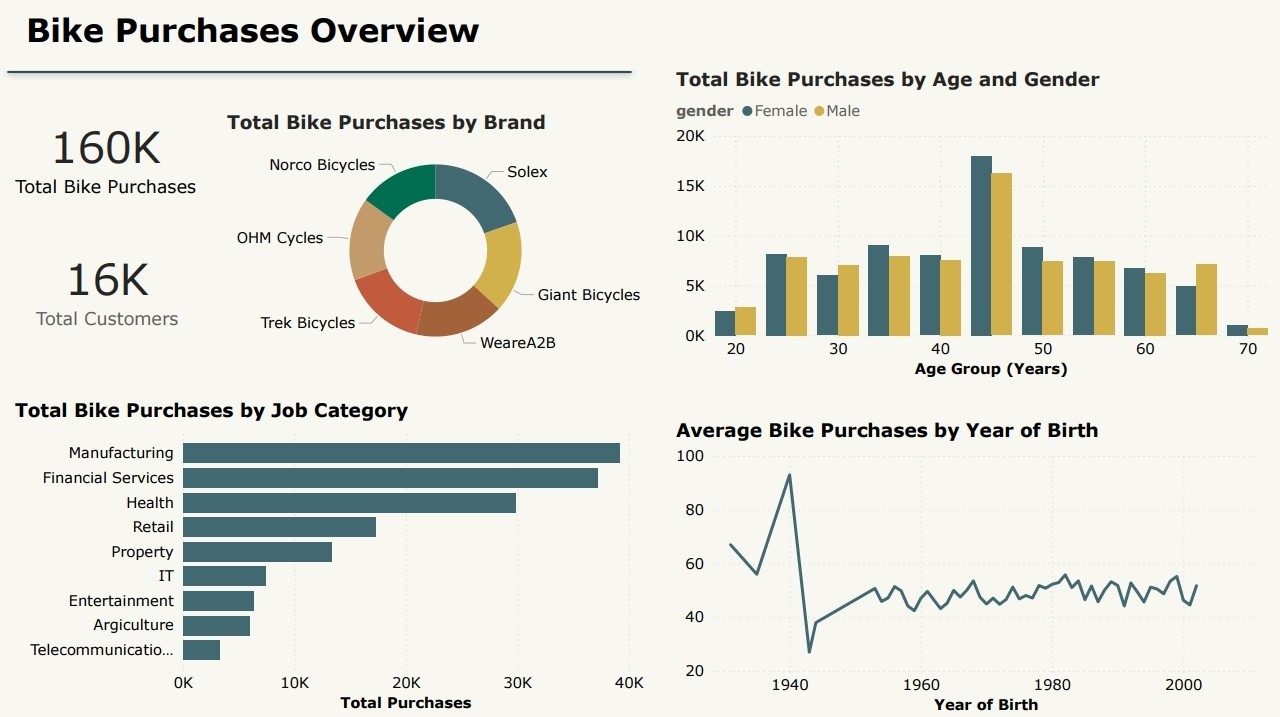
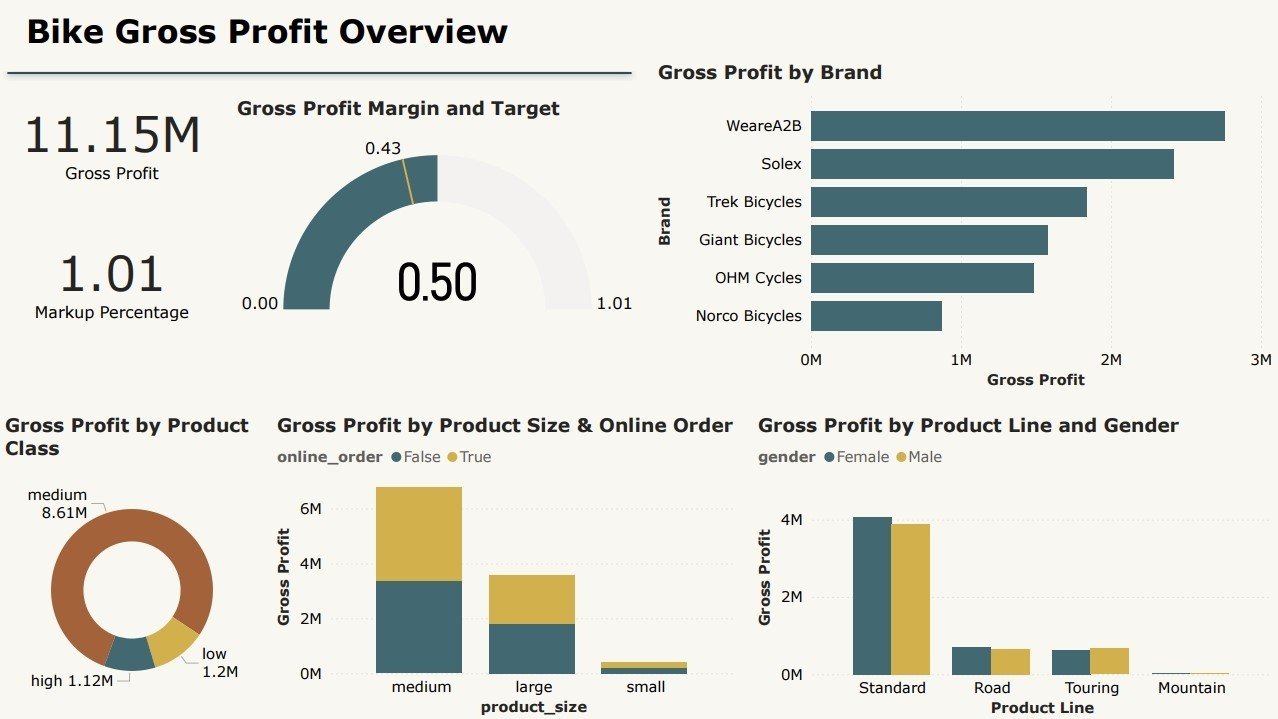
Bike purchase overview.
Bicycle purchases are led by Solex (20%), followed by Giant Bicycles (17%) and WeareA2B (16.8%). Age 45 records the highest purchases for both males and females, indicating a key customer segment. By job category, manufacturing, financial services, and health sectors lead in purchases, highlighting industries with strong cycling interest and potential targets for strategic marketing campaigns.
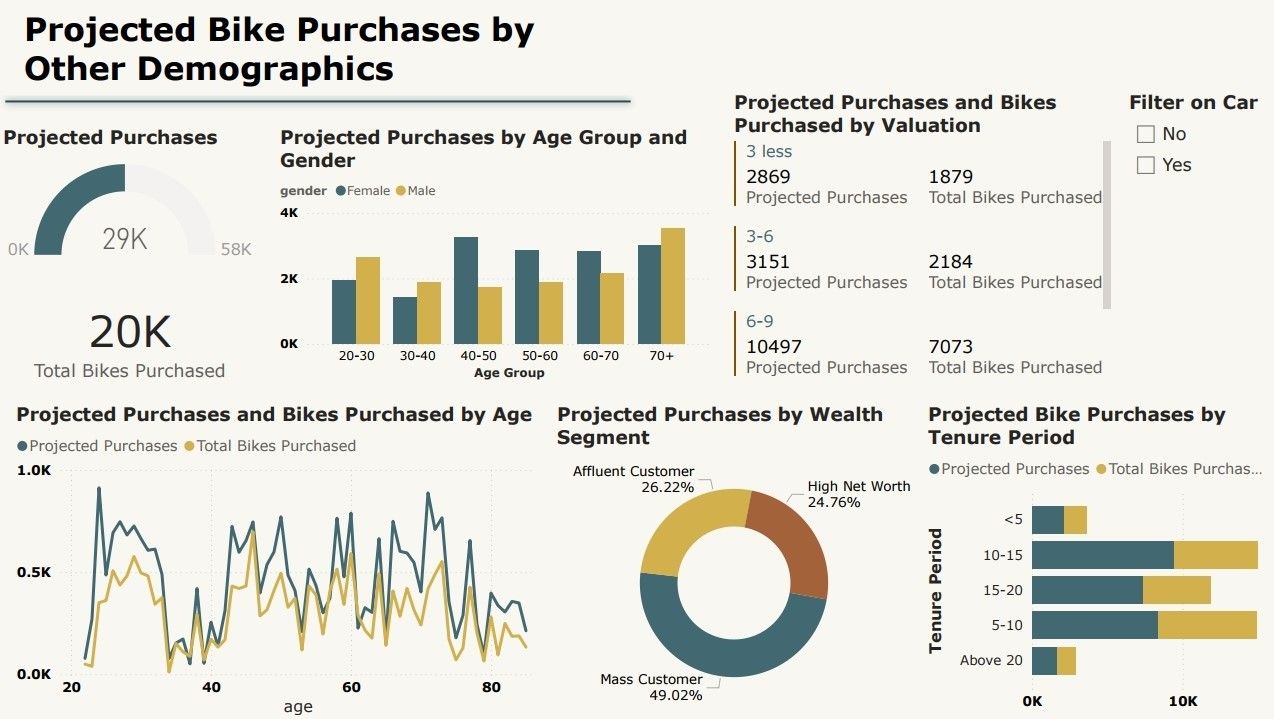
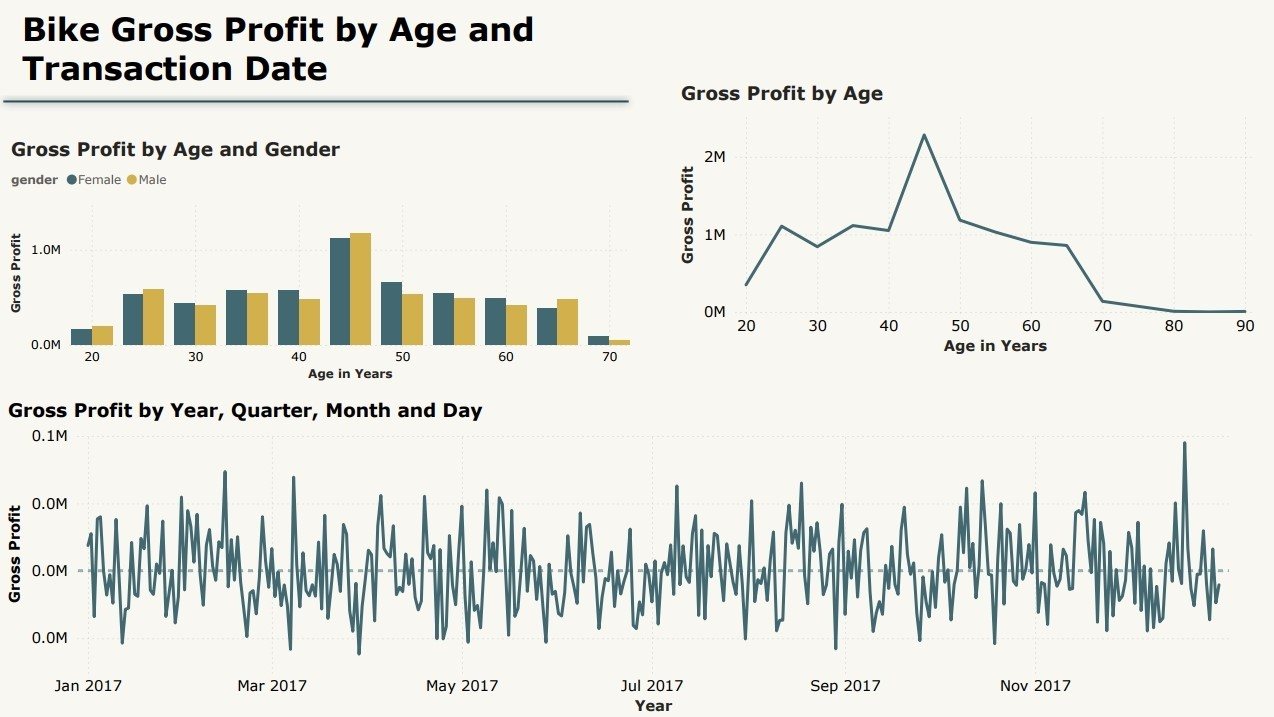
Projected Bike Purchases by Other Demographics.
Projected bicycle purchases are expected to rise from 20K to 29K, with the 40-50 age group leading demand. By wealth segment, mass customers account for 49%, followed by affluent (26%) and high net worth (25%) buyers. Tenure analysis shows the highest projected purchases from customers with 10-15 years, followed by those with 5-10 years, guiding targeted marketing strategies.
This project explores a soccer database from Kaggle, revealing key insights into Europe's major leagues from the 2008/09 to 2015/16 seasons. It presents a data-driven story with interactive league tables in Tableau, showcasing team performances and year-to-year improvements across all European leagues during this period.
From the 2008/2009 to 2015/2016 seasons, the English Premier League witnessed intense competition among top clubs and newly promoted teams, with shifting team performances and unexpected outcomes each season.
This project analyzes the Ultimate Soccer dataset, an open-source SQL dataset from Kaggle. It consists of seven interrelated tables. The Country table includes 11 European nations, while the League table lists their top championships. The Match table contains over 25,000 matches across seasons. Additionally, the Players table features over 10,000 players, and the Teams' Attributes table provides detailed performance metrics.
KPI: Year-over-Year (YoY) Club Performance Analysis.
YoY for teams across major leagues was analyzed, ranging from -1.3 to 1. Negative values indicate the biggest performance declines, while positive values represent consistent improvement. FC Zürich (Swiss Super League) with -1.3, Aston Villa (English Premier League) with -1.2, and VfB Stuttgart (Bundesliga) experienced the most significant declines. In contrast, Napoli (Serie A) with 0.95, Paris Saint-Germain (Ligue 1) with 0.84, and Borussia Mönchengladbach (Bundesliga) were the top three most improved clubs over the period, showcasing steady growth in performance.
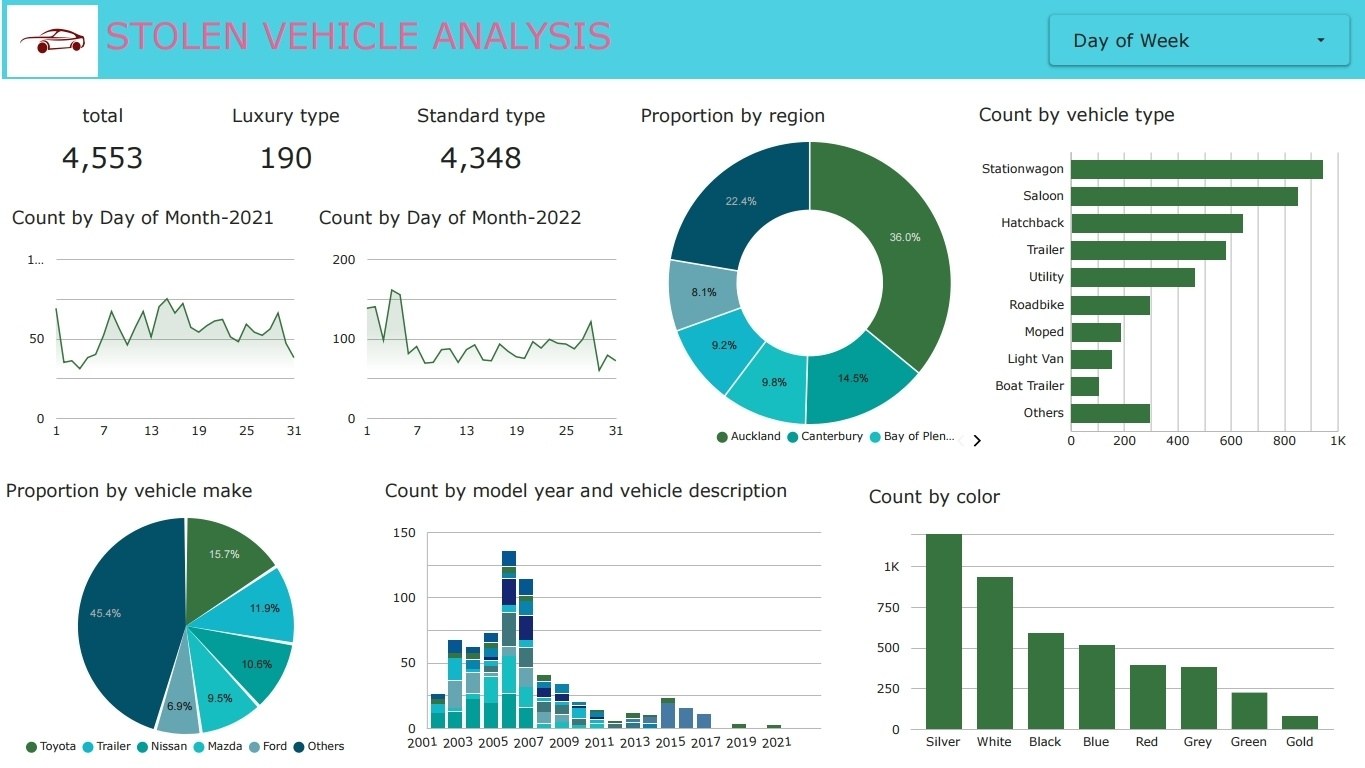
This project analyzes motor vehicle theft data from the New Zealand police department and focuses on SQL-based exploration. Using SQL statements, I conduct exploratory data analysis (EDA), perform table joins, and apply aggregations to uncover meaningful patterns. Key findings are visualized in a Google Looker Studio dashboard, aiding law enforcement and policymakers in enhancing community safety and preventing vehicle theft.
These findings provide valuable insights into vehicle theft trends, helping law enforcement and policymakers develop effective strategies to reduce theft and improve public safety.
This analysis uses stolen vehicle data from the New Zealand police department, sourced from Kaggle. The six-month dataset includes six tables with details like vehicle type, make, year, color, date stolen, and region. The study identifies theft patterns to assist law enforcement in policy-making.
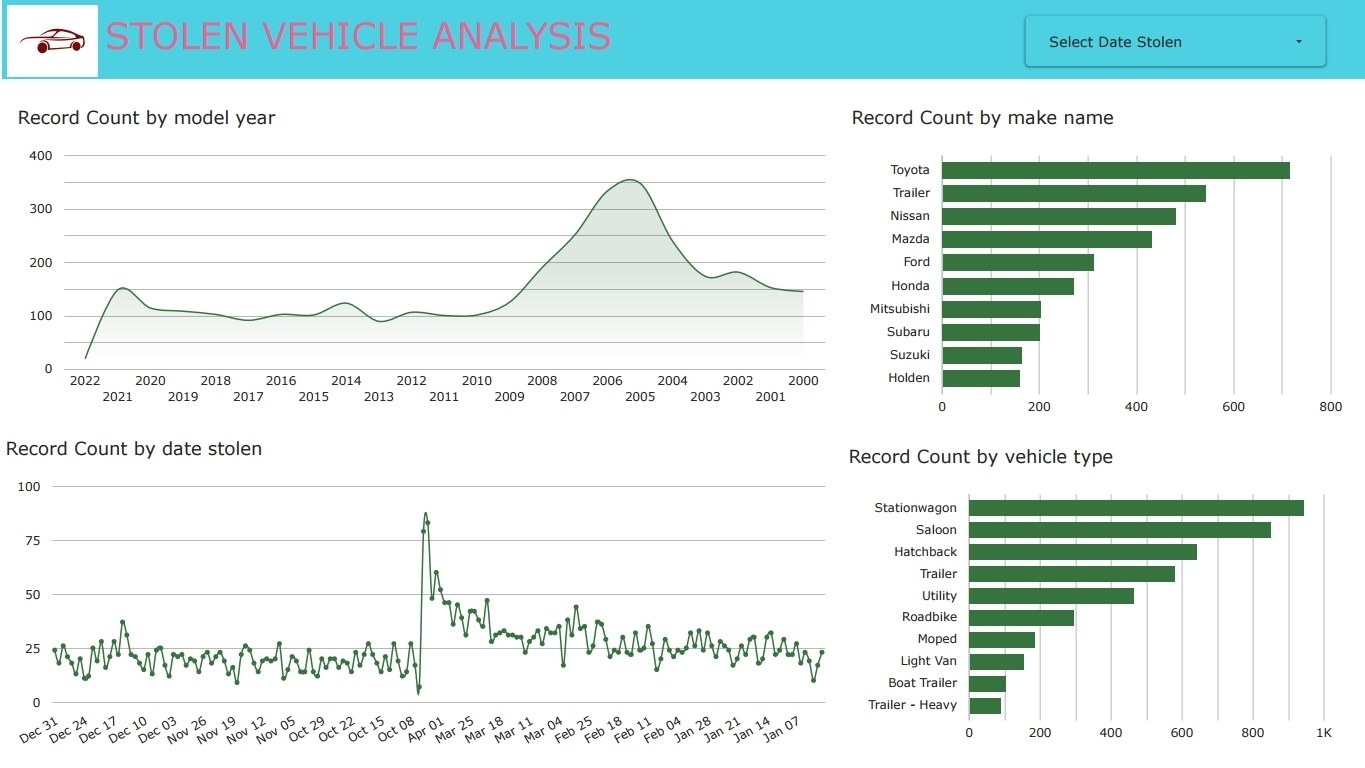
The analysis reveals that vehicles from model years 2003 to 2008 are the most frequently stolen. Station wagons, sedans, and hatchbacks top the list, with Toyota, Trailer, and Nissan as the most targeted makes. Conversely, Subaru and Suzuki are least stolen. Notably, April 4, 2022, saw the highest thefts, while April 6, 2022, recorded the fewest.
Thank you for visiting my portfolio! I am always open to new opportunities and collaborations. If you have any questions or would like to discuss a project, feel free to get in touch.